Detection,
Confirmation and Quantification of FGF2 (BOVINE)
Cambridge Healthtech Institute’s Second
Annaual
TISSUE ENGINEERING/REGENERATION HEALING/STEM CELL
BIOLOGY
October 3-5, 1999 Pittsburgh, Pennsylvania
AGUILAR
L. C., SANCHEZ J., CEJA R., SOTELO A., ALFARO
F.AND ISLASA.
Instituto de Investigaciones
en Neuroplasticidad y Desarrollo Celular, A.C.
Departamento de Biología Celular y Molecular,
Universidad de Guadalajara.
Contents
• Abstract
• Materials
and Methodsl
ABSTRACT
Our group has worked
out in different methods of characterization of
FGF-2 molecule. Indeed, it is not a trivial task,
to detect it, nevertheless the following methods
are enough to detect or discard the presence of
FGF2 (Bovine). First we performed the HPLC technique
at 266nm (which was the optimal length wave for
this molecule ), in where it was determined the
Retention Time (RT) of the FGF2 (Bovine) and compared
it with an FGF2 control (Sigma Chemicals, St Louis
MO). After that, it was developed an ELISA test,
using polyclonal antibodies against FGF-2 Bovine,
developed in rabbit (R&D). It was used several
proteins as negative controls (Ovoalbumin, Bovine
and Human Albumin and Tripsinogen). The above
mentioned proteins and the FGF-2 were fixed in
the wells at 0.1, 1.0, 2.5, 5.0 and 10 µg. Finally
it was done a comparative analysis between Lowry
method and absorption at 280nm, in order of establish
a reliable method for FGF2 quantification.
|
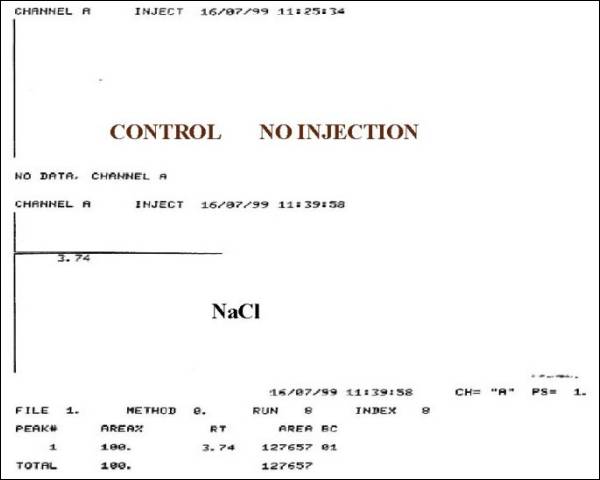
Fig.
1.- Control No Inyection. |
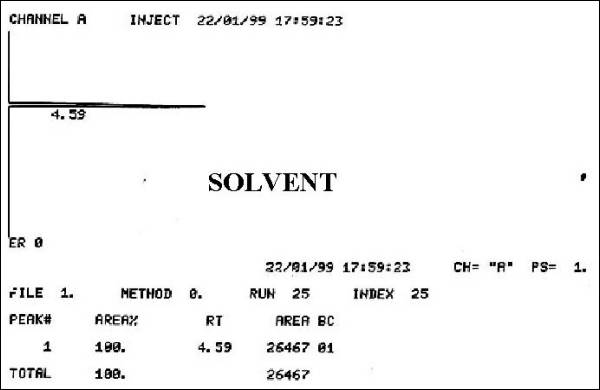
Fig. 2.- Solvent
|
The results showed
that, FGF-2 obtained in our laboratory, presented
the same RT, that the FGF-2 Bovine from Sigma
(RT=3.96 ± 0.06), The limit of detection of our
HPLC technique was of 10 µg/ml, lower amounts
were not detected in several trials.
The ELISA test
showed, that the FGF-2 (from our lab) had an increase
in the Optical Density data, in a dose response
mode. The concentrations lower to 2.5 µg, in some
experiments were not statistically different when
Human Albumin was compared to our FGF-2, meanwhile
amounts of 5.0, 7.5, 10 µg were significantly
different (p<0.001). The differences between
our FGF-2 and the other controls were all significantly,
from 2.5 to 10 µg. At lower concentrations it
is not possible discard the presence of FGF-2
with this method.
Finally the detection
of FGF-2 and its controls, performed at 280nm,
showed an excellent linearity response, meanwhile
the Lowry method did not fit this requirements
of linearity at the concentrations probed (10-1000µg).
It is concluded, that the molecule isolated in
our laboratory is indeed FGF-2 Bovine.
|

Fig.
3.- FGF2 Sigma + Solvent |
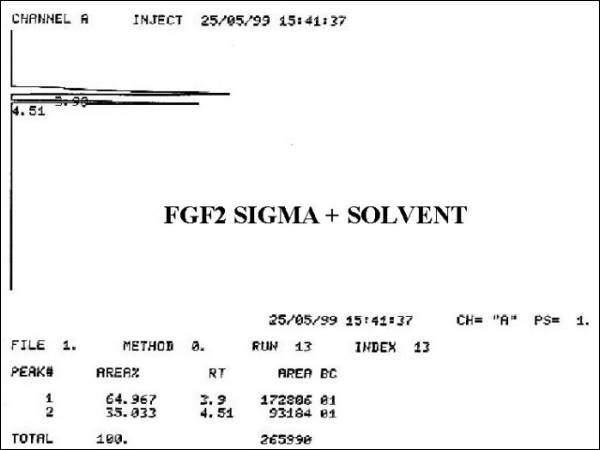
Fig. 4.- SFGF2 Sigma
+ Solvent
|
MATERIALS
AND METHODS
CHROMATOGRAPHIC
ANALYSIS
FGF-2 was then
injected to an HPLC (Delta prep 3000 Waters (R))
with a Analytical studies were performed by HPLC
with the µ Bondapak c-18 column (3.9 x 300 mm)
and 80 % of TFA 0.1 % and 20% of acetonitrile
as eluent, flowing at 0.8 ml/minute.Detection
was performed in a spectrophotometer (Waters (R)
Lambda-max mod. 481) at 266 nm; the data were
integrated in a Data Module (Waters (R) 745).
|
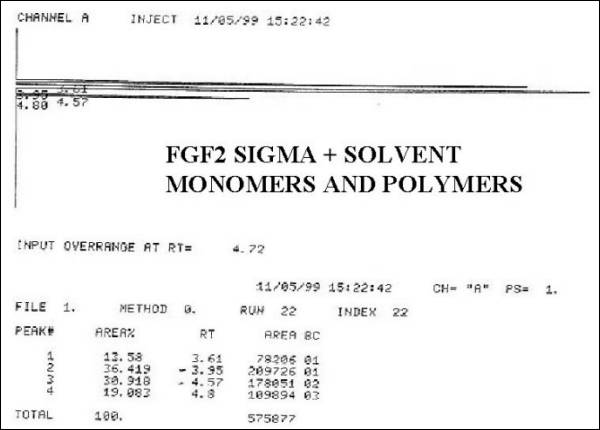
Fig.
5.- FGF2 Sigma + Solvent. Monomers and
Polymers |
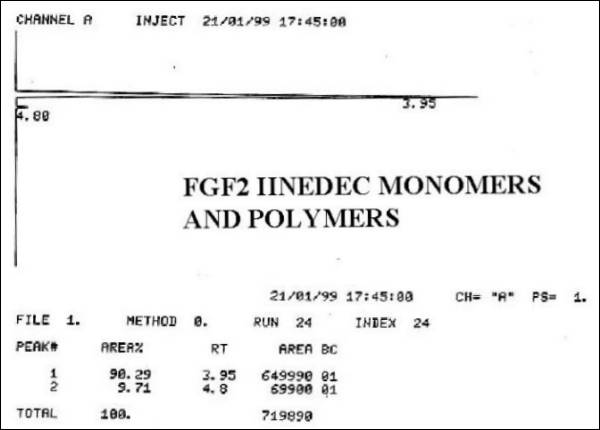
Fig. 6.- FGF2 IINEDEC
Monomers and Polymers
|
|
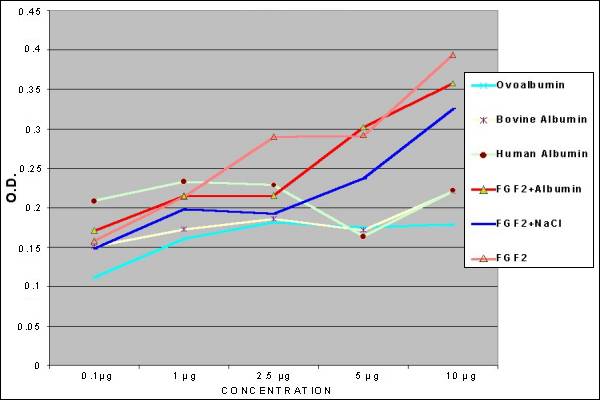
Fig.
7.- Elisa Test for FGF2 and other Proteins |
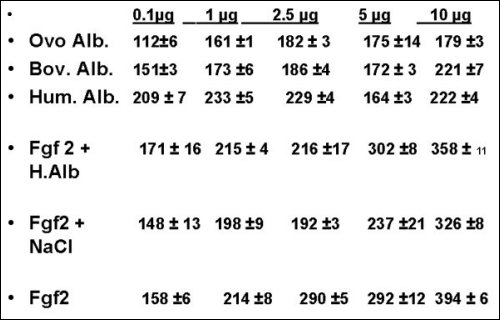
Fig. 8.- Elisa Test
for Bovine FGF2. (Results in O.D ±
S.E. X 10 -3)
|
|
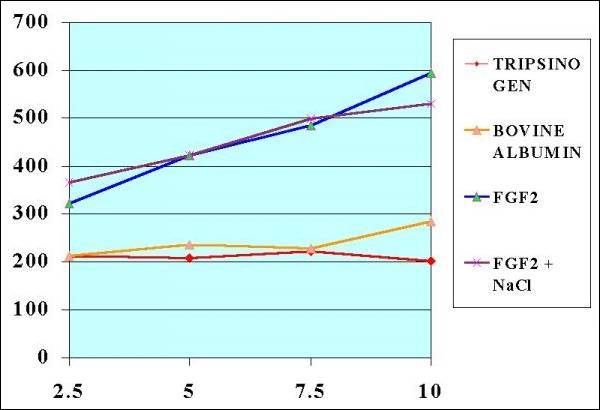
Fig.
9.- Elisa Test to Confirm the FGF2 presence
using Polyclonal Rabbit anti Bovine
FGF2 Antibodies. |
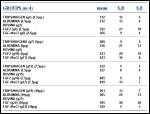
Fig. 10.- Statistical
Analysis (NOTE.- The results x 10
-3)
|
|
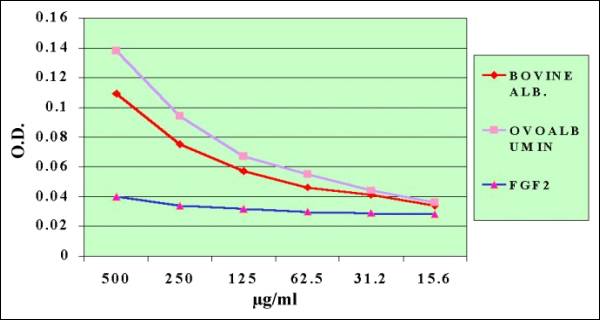
Fig.
11.- Comparative Quantification of BOVINE,
OVO Albumin and FGF2 by Lowry Method |
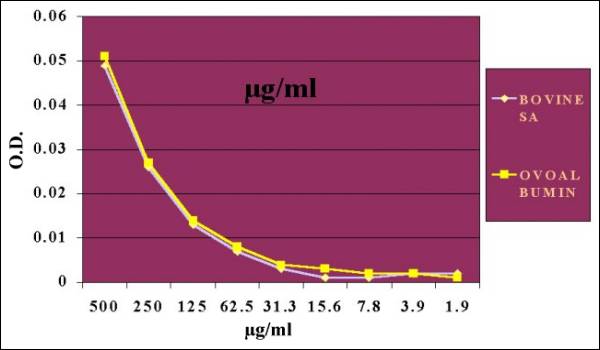
Fig. 12.-Albumins
Quantifications at 280 nm
|
|
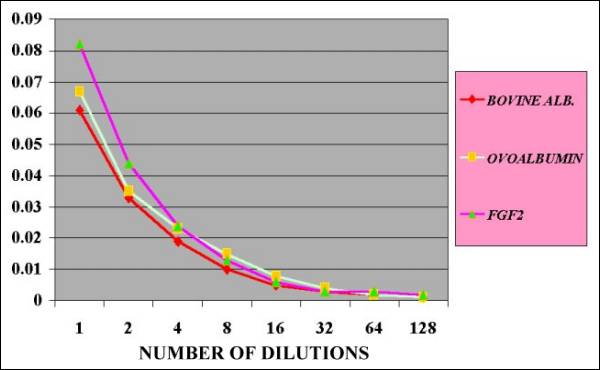
Fig.
13.- Comparative Quantification of BOVINE,
OVO Albumin and FGF2 by Lowry Method |
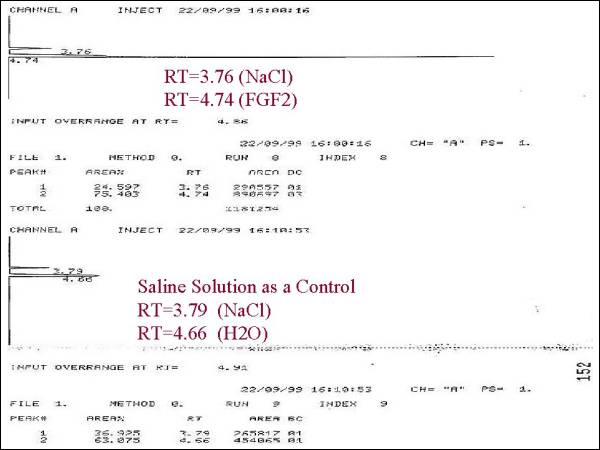
Fig. 14.-Albumins
Quantifications at 280 nm
|


